We often hear that in order calculate the Risk Posture; we have to use Probability times impact. But what does it mean in real world?
I will try to structure the response.
Before we dive into risk itself, lets identify and define specific terms and their meaning. For simplicity, I will scope it down to 3 areas:
- Risk
Risk posture (or rating) is driven by different factors and risk can exist in itself (Operational Risk), or be a sub risk (Cyber Security Risk), or can be ‘scoped’ into the area (like Business Process, or Asset. Nonetheless, in the end, it depends on who is looking – Board is interested in seeing “big” picture, while specific departments, or asset owners prefer a more ‘my area of responsibility’ approach
- Risk is a probability of potential negative event that the organization can face right now
- Risk can be
- Top-risk (Parent) that contains other
- Sub-risks (children)
- Risk ‘posture’ is driven either by
- Child Risks, or
- Controls
- Asset
An asset exists to support specific business process or multiple processes. While, philosophically, business process could be considered an asset, we will take more scoped approach and assume that our assets are hardware and software assets that process data. - Control
- Can be Parent control that aggregates multiple child controls
- Can be single and unique control that sits on the asset
Putting it all together
Let’s assume that we have the following structure in place and we need to determine the risk posture for that structure.
- Risk
- Parent: Confidentiality
- Child 1: Data Breaches
- Child 2: Unauthorized Data Access
- Parent: Confidentiality
- Asset 1
- Web application for customers where they can perform financial transactions
- Asset 2
- Web application for customers where they can view their insurance claims
With structure above, both assets deal with Restricted Data. First has access to financial data, and the second has health data. Both applications are subject to strict regulatory requirements and must have a Multi Factor Authentication in place. Let’s build MFA controls. Ideally, both controls have a parent Control that could be used to aggregate child data and also used to create more controls.
- Overall Parent Control: MFA Control
- Asset 1 Control: MFA Control 1 (Managed by Control Owner 1)
- Asset 2 Control: MFA Control 2 (Managed by Control Owner 2)
So, we have two assets with separate asset owners and two separate control owners. Each ‘instance’ of control can have its own ‘flavour’ (one could be out of the box MFA, another could be custom built). But, nonetheless, they all are linked to the Parent Control.
Probability x Impact
Now, during the assessment, each control can be evaluated for Probability of Negative event and the impact that even can cause.
There are multiple ways organizations can ballpark probabilities and impacts. It could be driven by qualitative, or quantitative approaches. Most organizations do both. If, for example, impact is $100,000 then impact is Moderate.
Assessing Asset Controls
Let’s look into the following assessment for control based on (Low, Moderate, High and Critical):
- Control 1
- Probability = Low
- Impact = High
- Control 2
- Probability = Moderate
- Impact = Critical
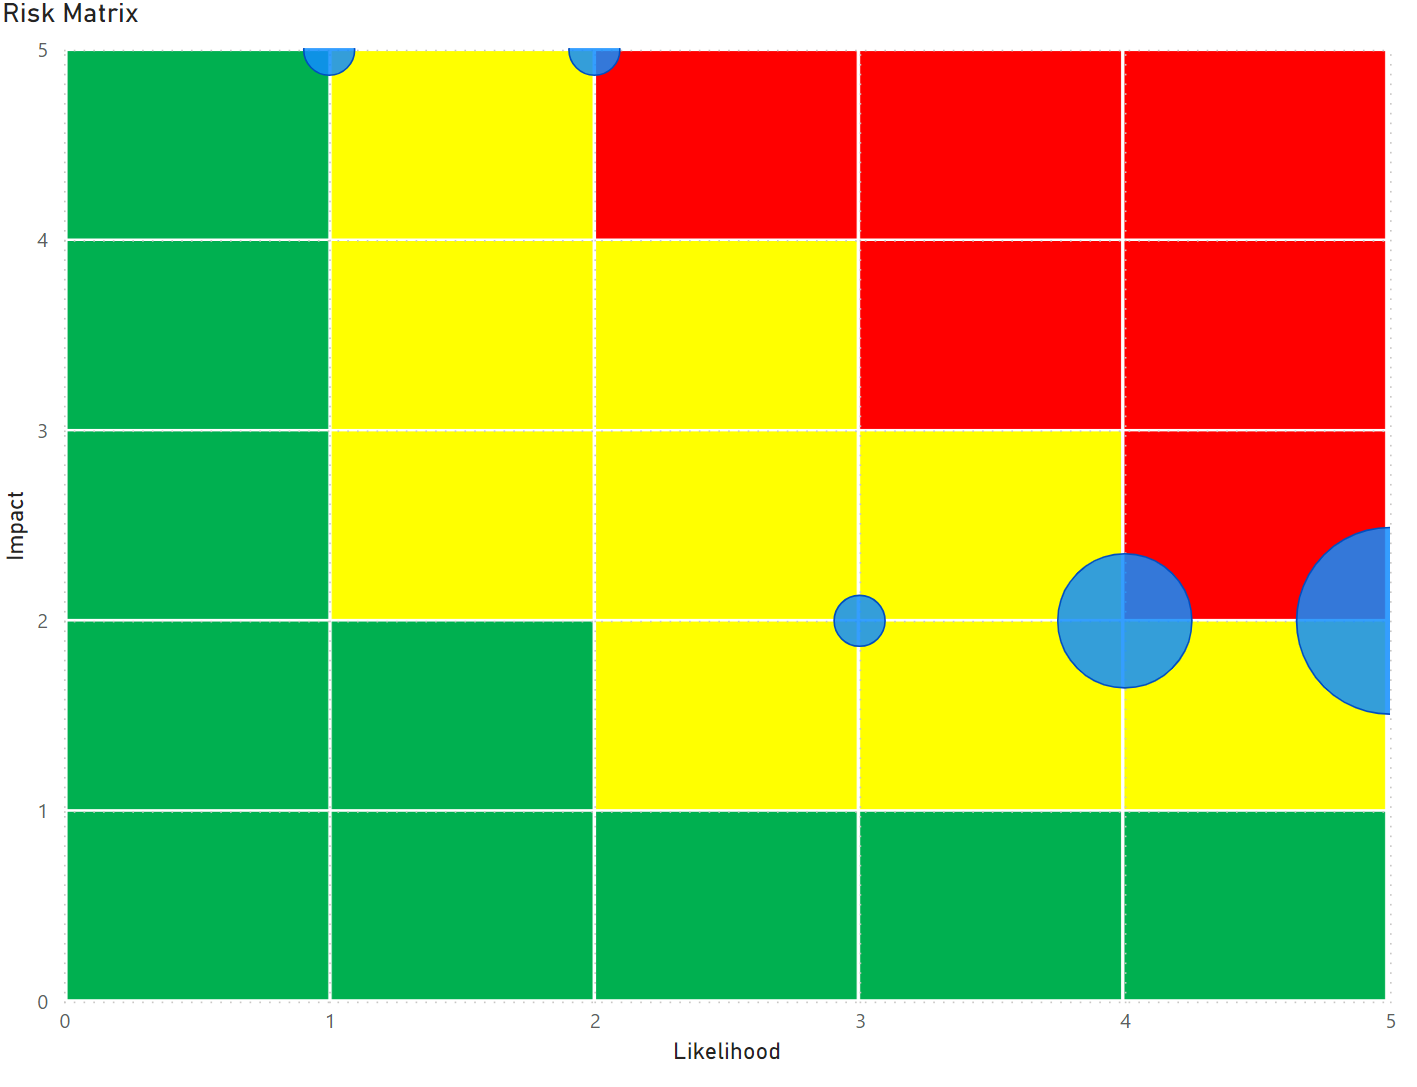
Now we have to “multiply” it to understand the Residual Risk. For that purpose, organizations usually use a Matrix like below (Probability – X axis, Impact – Y axis)
| CRITICAL | HIGH | MODERATE | LOW | |
| CRITICAL (12) | CRITICAL 12 | HIGH(8) | MODERATE (4) | CRITICAL |
| CRITICAL (9) | HIGH (9) | HIGH (6) | MODERATE (3) | HIGH |
| HIGH (8) | HIGH (6) | MODERATE (4) | LOW (2) | MODERATE |
| MODERATE (4) | MODERATE (3) | LOW (2) | LOW (1) | LOW |
Per this matrix we get:
- Asset 1 + Control 1 Risk score is Low x High = 3 (Moderate Risk)
- Asset 2 + Control 2 Risk score is Moderate X Critical =8 (High Risk)
Now, we can have another reference table to aggregate risks and do as follows:
| Average Risk Value Range | Risk Rating |
|---|---|
| 1.0 – 2.9 | Low |
| 3.0 – 5.9 | Moderate |
| 6.0 – 8.9 | High |
| 9.0 – 16.0 | Critical |
- Risk Rating for Parent Control
(averaging children: Control1 and Control2)- Calculation: (8+3)/2 = 5.5
- Risk: Moderate
Solving for parent Risk
Now when get the dynamics, let’s assume we have 10 different controls that implemented among various assets. Essentially, we consolidate all controls bypassing the assets and insert them directly into the risks they linked to. Let’s do some fictitious assignment
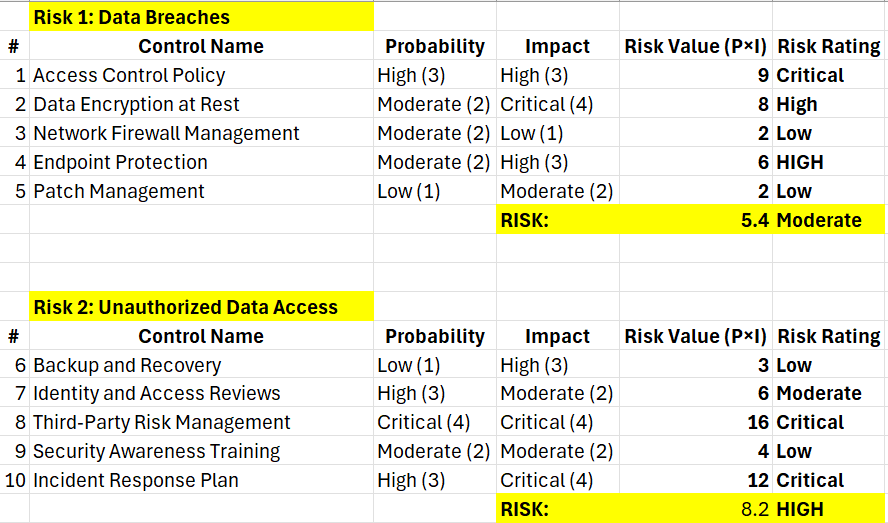
Par table above, we can actually see the risk value for each child risk (Risk 1 and Risk 2).
Calculating the Parent “Confidentiality” Risk
Since our parent “Confidentiality” risk has children listed above, we can utilize the same approach and aggregate risks “up”.
This can be done by either averaging all existing control ratings from “child” risks, or utilizing “child” risks values we already gathered. Therefore our parent, without direct connection to any controls, can be used to roll up and aggregate risk posture, that can be, in turn, correlated with the Organizational Risk Appetite and thus serve an ‘overall’ security posture indicator.
- Confidentiality Risk
(averaging children: Risk 1and Risk 2)- Score: (5.4+8.2) / 2 = 6.8
- Rating: High
There are multiple approaches to calculate the risk, and I’ve used the “average” method. It is quite simple and gives the general idea of the risk aggregation and how Probability X Impact is used.
On the sidenote, risk posture is not a KRI. Risk posture is ‘current’ state, while KRIs are forward looking.
KRIs are heavy related to controls and their performance. So, if control is effective and performing well, the KRI can analyze the specific operational metrics behind the control and, with thresholds defined, can be extrapolated into the potential future control failures. As a result, KRIs should not exist in the vacuum and must be supporting existing controls.
Leave a Reply