Project: MapGRC (Laravel 12, Multi-Tenant)
Feature: Dynamic Sankey Diagram Visualization Page
Goal: To create an interactive Sankey diagram that visually represents relationships between GRC entities (Libraries, Types, Objects, and Requirements) across user-defined steps or sections, allowing users to explore complex mappings in a structured, intuitive, and analytical way.
🧩 Functional Requirements
1. Page Functionality
- The Sankey Diagram Page should:
- Dynamically render relationships between selected entities.
- Support up to 5 user-defined sections (“steps”).
- Automatically compute relationship flow (links) between consecutive steps.
- Update the visualization live based on user selections or filters.
2. User-Defined Steps
- Users can define between 2 and 5 steps (minimum 2 required to generate flows).
- Each step consists of a hierarchical entity chain:
- Library
- Type(s) (optional, multi-select with “All” and “None” options)
- Object(s) (optional, displayed in a parent-child structure)
- Requirement(s) (optional, filtered by selected object)
- Each step must dynamically filter available options based on the previous selection (e.g., only show Objects under the selected Library and Type).
3. Tree Selection
- Display each level (Library, Type, Object, Requirement) as an expandable tree structure with:
- Checkboxes for selection.
- “Select All” / “Deselect All” at each hierarchy level.
- Lazy loading for deeper levels (to optimize performance with large datasets).
4. Search Functionality
- Each step includes a search box that:
- Searches across all levels (Library, Type, Object, Requirement).
- Displays matching items with all parent nodes expanded.
- Highlights matching terms.
- Preserves selection state when filtering.
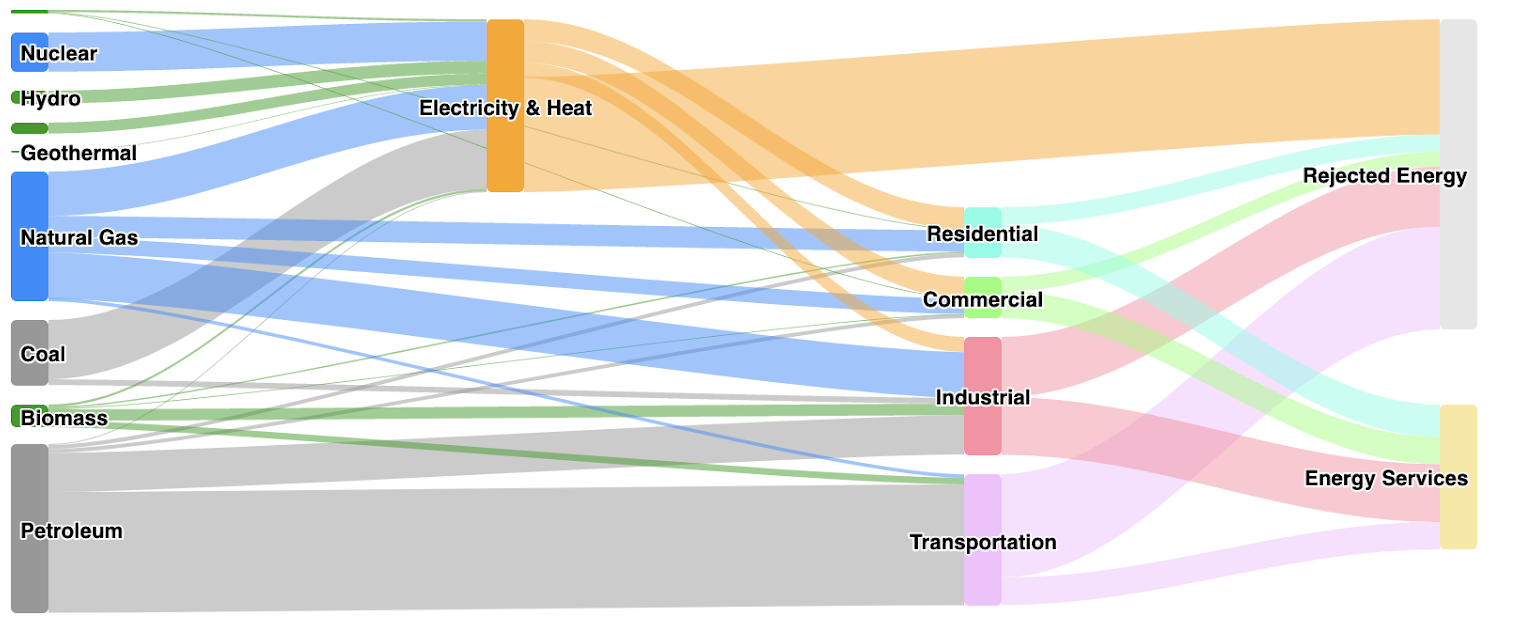
5. Diagram Visualization
- The visualization uses a Sankey Diagram (e.g., D3.js Sankey, Plotly Sankey, or Google Charts).
- Nodes represent selected entities from each step.
- Links (bands) represent mappings/relationships between steps.
- Band thickness corresponds to the number of mappings.
- Each band and node supports hover tooltips showing details:
- Entity name, type, and number of connections.
- Clicking on a node or band opens a detail pane (Livewire or side drawer) showing related data.
6. Zoom and Pan
- Diagram must support:
- Zoom in/out via mouse scroll or on-screen controls.
- Pan via click-and-drag.
- Reset view button.
7. Data Handling
- Backend data is already available through Laravel models and relationships.
- The Livewire component (e.g.,
SankeyDiagram.php) will:- Accept selections from the UI.
- Fetch related entities and relationships.
- Return data formatted for the Sankey chart (nodes + links JSON).
8. Persistence
- User selections (steps, filters, searches) should persist:
- During navigation within the session.
- Optional: Saved to a user preference table (e.g.,
user_settingsJSON).
9. UI/UX Enhancements
- Use Tailwind and Alpine.js for lightweight interactivity.
- Include:
- Collapsible step panels.
- Animated transitions when updating diagram.
- Loading indicator during data fetching.
- “No data” state when no mappings exist.
- Optional color schemes (per library or step).
Enhancements
| Area | Suggestion | Benefit |
|---|---|---|
| Naming “Steps/Sections” | Use “Stages” or “Mapping Layers” to convey flow (e.g., Layer 1 → Layer 2). | Clearer mental model for users. |
| Data Layering | Implement a small backend endpoint (/api/sankey/data) to output JSON ready for D3 or Plotly. | Enables reusability and performance caching. |
| Caching | Cache Sankey data per selection hash (using Redis or database). | Faster rendering for repeated queries. |
| Performance | Use lazy loading or pagination for large object/requirement trees. | Prevent UI lag on large datasets. |
| Details Drawer | Add a slide-in panel on node/band click showing detailed mapping info (related objects, count, links). | Improved usability without modal interruptions. |
| Export Feature | Allow export to PNG / SVG / JSON. | Supports documentation or reporting. |
| AI Insights (Future) | Integrate AI summarization: “Top relationships by volume” or “Unmapped areas.” | Adds analytical capability. |
| Access Control | Ensure step definitions and data follow current tenant_id restrictions. | Prevents data leakage. |
⚙️ Technical Notes
- Frontend Libraries: D3.js (recommended for fine control) or Plotly.js (for simpler integration).
- Livewire Component Example:
App\Livewire\Mappings\SankeyDiagram.php- Methods:
loadData(),filterStep(),render()
- Blade View:
resources/views/livewire/mappings/sankey-diagram.blade.php
- Route:
Route::get('/mappings/sankey', \App\Livewire\Mappings\SankeyDiagram::class) ->middleware(['auth', 'tenant']) ->name('mappings.sankey');
Next Steps
- Confirm naming for “steps” (Steps / Layers / Sections).
- Decide which visualization library to use (D3.js, Plotly, or Google Charts).
- Define data structure for Sankey JSON (
nodes,links). - Build prototype with dummy data for UI testing.
- Integrate real data and refine interactions.
Leave a Reply